Part I: All Things Utilities
Everything You Need To Know About How Electricity Works ...
... but may have been too embarrassed to ask
- Carbon
- ESG + Corporate Sustainability
- Energy
Practices Engaged

All Things Utilities
PART I of IV: Utility Companies

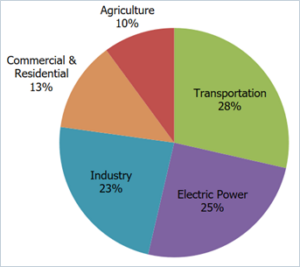
Welcome to a 4-part series where our Operational Carbon Technical Lead and Licensed Engineer, Ilana Cember, dives into:“(Almost) Everything You Wanted to Know About Electricity But Are Embarrassed to Ask”Understanding the basics of electricity generation, distribution, purchasing, greenhouse gas emissions, and the utility grids is key to understanding how we change any of those to keep our global commitment and meet the Paris Climate Accord. We will go into the “why” for each of these topics as they are covered. Electricity generation makes up 25% of the United States greenhouse gas emissions. 61% of the electricity comes from fossil fuels, mostly coal and natural gas. (i) Figure 1. US Greenhouse Gas Emissions by Sector (2021) (i)
TOPICS WE WILL COVER
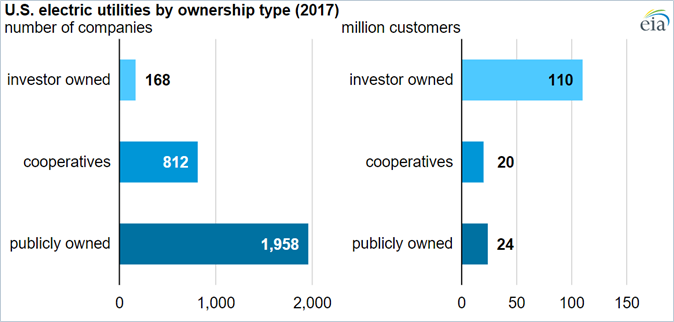
Part I: All Things UtilitiesWHY?The organizational structure and type of utility companies significantly influence how they respond to changes in policy and regulation, and how these changes are perceived and supported by the public. Most customers receive services from private, for-profit utilities, which naturally have priorities that may differ from goals such as mitigating climate change. There are four main types of utility companies: independent, publicly owned utility (POU), investor-owned utility (IOU), and co-operatives. Although publicly owned utilities (i.e., government-owned) account for the highest number of utility companies, most consumers, about three-quarters, are served by investor-owned utilities (i.e., for-profit), as depicted in Figure 2 and Figure 3. Figure 2. US Electric Utilities by Ownership Type (2017) (ii)
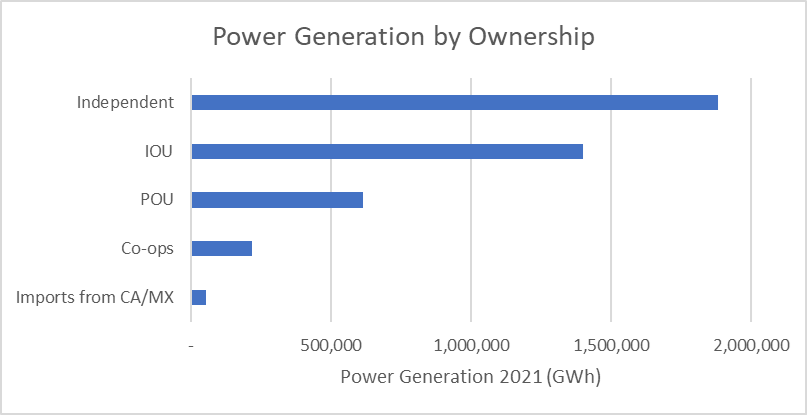
Figure 3. Detailed Breakdown of Power Generation by Ownership Type (2021)
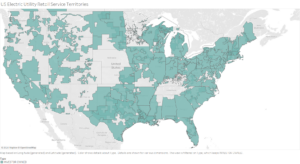
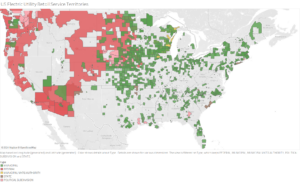
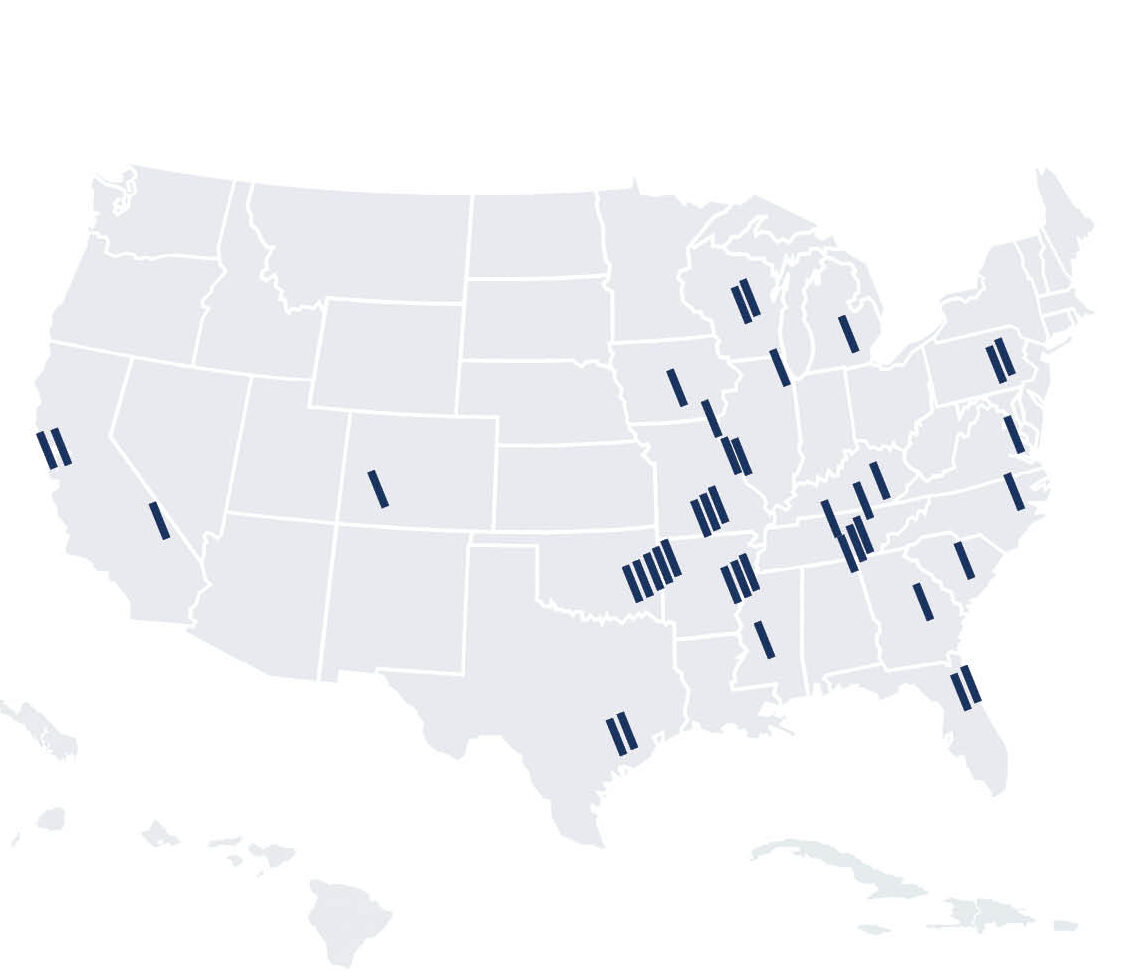
The maps below show the coverage of the utilities and examples of each. INVESTOR-OWNED (FOR PROFIT, PRIVATE)Figure 4. US Map of Investor-Owned Utilities (2023) (iii)
The most recognizable IOU’s may be Pacific Gas and Electric and Southern California Edison Company. While investor utilities are typically governed by a Public Utility Commission (PUC) who must approve rate increases, private companies are beholden to shareholders not customers, creating incentive to raise fees whenever possible. This also disincentivizes adopting less expensive technology or operational solutions to increase the capacity of the grid or renewable generation, as the utility business model places a premium on building and maintaining large assets. Most utilities make money through a regulated process in which they can charge customers to cover costs plus a guaranteed profit, so low-cost investments do not result in increased fees (and profit). (iv) While California is almost exclusively supplied by IOU’s, the region has the lowest completion rates for connecting renewable energy to the grid. (v) I’m sure many of our clients who have worked with these utilities have many opinions on the quality of their customer service! Governments are taking notice; for example, the federal government plus twenty-one states recently introduced a grid upgrade initiative, focused on low-cost investments that increase grid capacity (vi) and Colorado created a law mandating their IOU invest in grid upgrades and improve grid connection rates (vii). Figure 5. Renewable grid interconnection completion rates (viii)
PUBLICLY OWNED (FEDERAL, STATE, OR CITY)Figure 6. US Map of Publicly-Owned Utilities (2023) (ii)
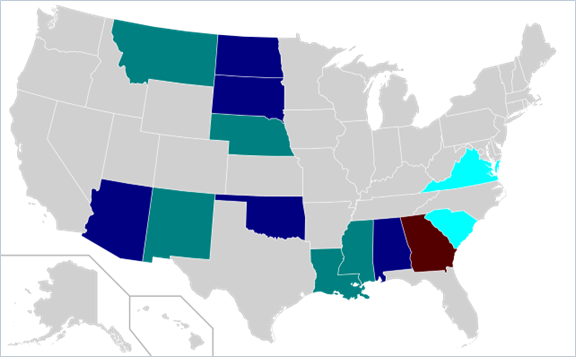
The largest POU besides Puerto Rico is the Los Angeles Department of Water and Power. Utility commissioners or typically elected or appointed by an elected official, as shown in Figure 7. In general, publicly owned services are beholden to the voters/residents. Figure 7. US Map of POU Governing Body (ix)
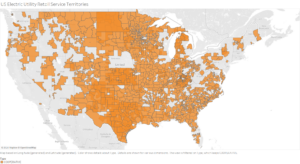
COOPERATIVESCooperatives (co-ops) are non-profit, member-owned utilities. As you can see in the map below, co-ops cover a lot of land area and were specifically created to ensure utility service in more rural areas. Figure 8. US Map of Cooperative Utilities (x)
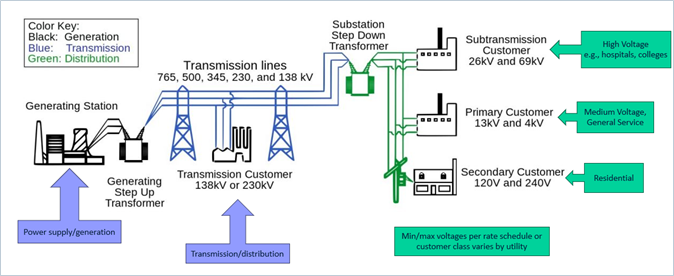
Utility Supply and RestructuringWHY?We cannot talk about the energy grid without talking about procurement which necessitates expanding on the utility structures shown above. Utility GridsThere are two main aspects of the electricity grid – generation and transmission/distribution, shown in Figure 9 below. Generation, aka the power plant, could be coal-fired, natural gas-fired, nuclear-powered, or renewables like solar, wind, or hydro. The power plant takes any of these fuels and turns them into electricity. (The impact of fuels on the grid and power production will be discussed later.) This electricity then gets sent (transmitted and distributed) across the country where it is used. The large transmission lines are at an extremely high voltage, which can be dangerous when not managed properly. (PG&E, the largest IOU, if you recall above, has allegedly been responsible for over 30 wildfires caused by transmission lines. (xi) The electricity is finally modified to lower voltages for distribution to customers. Figure 9. Electricity Grid Diagram(xii)
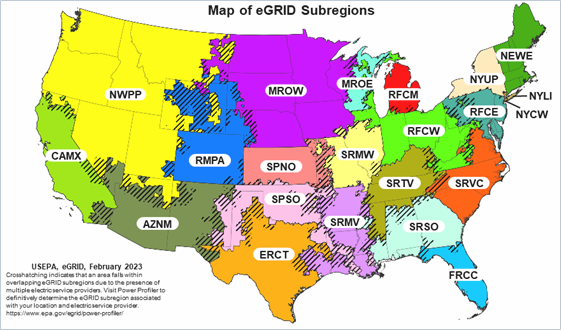
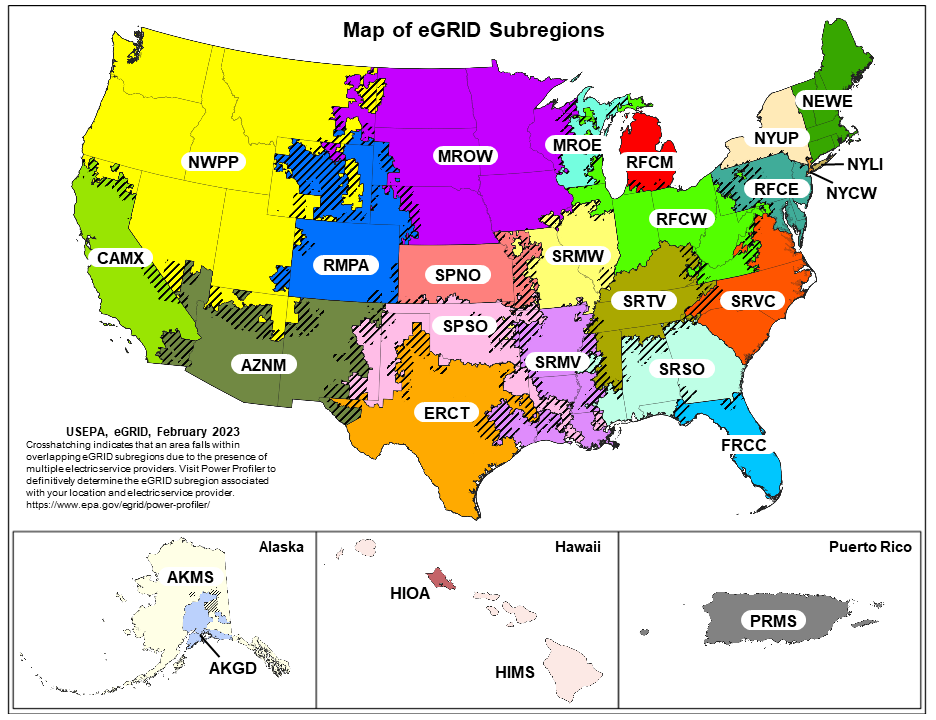
The US Environmental Protection Agency (EPA) produces the emissions and generation resource integrated database (EGRID), as shown in Figure 10 below. (Map limited to contiguous states for convenience.) Figure 10. US Map of EGRID subregions (xiii)
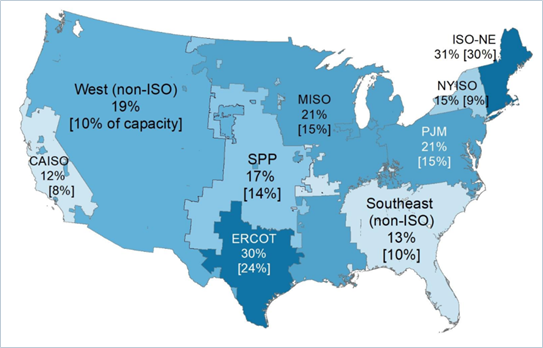
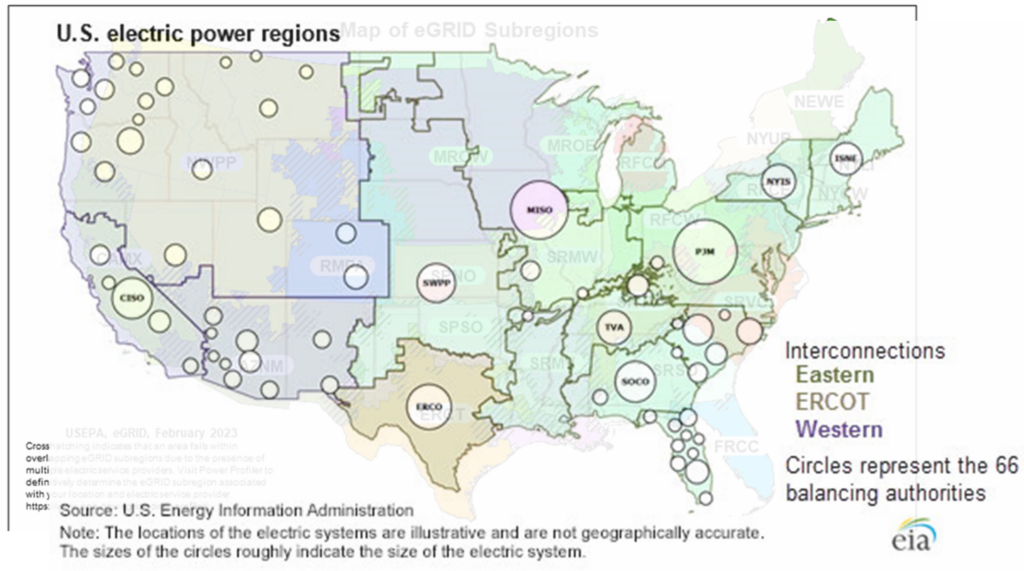
These regions generally line with the US electric power regions, shown in Figure 11 below. Note that ERCOT (Electric Reliability Council of Texas) is its own interconnection, which means it (Texas) is separated from the other power regions. This prevented additional power from being routed to the Texas grid during the 2021 winter outage. (xiv) We will discuss Texas’ unexpected progress on renewables grid connection and resiliency later. Figure 11. US Electric Power Regions Overlaid on EGRID Map (xiii xv)
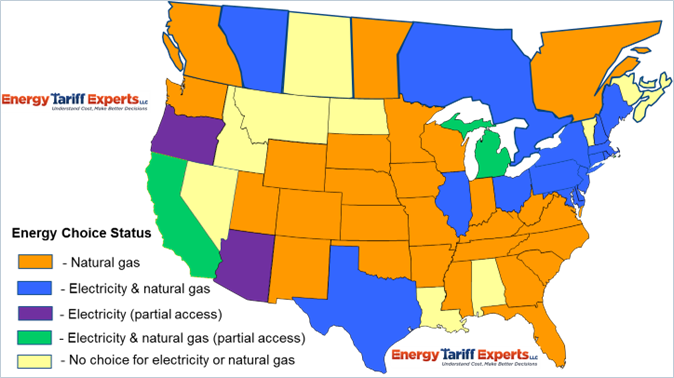
Electricity SupplyIn 1935, the government passed the Public Utilities Holding Company Act (PUHCA). Before this, there was no regulation on electricity charges, supply, etc. The PUHCA involved a key trade-off: utilities received a monopoly, granting them exclusive rights to supply energy and charge for it, while consumers benefited from regulation. This meant that utilities had to meet regulatory requirements and were responsible for the installation, maintenance, and upkeep of the energy supply. Refer to beginning regarding mismatched incentives for private utilities. Beginning in the 1970s with the US Energy Crisis, the regulatory structure started to change, culminating in PUHCA’s federal repeal in 2005 with the Energy Policy Act. The current state of energy deregulation is illustrated in Figure 12 below. It is important to note that energy deregulation only applies to energy generation. The details of how energy is delivered to consumers will be discussed later. Figure 12. US and Canada Map of Energy Choice (Deregulation) (xvi)
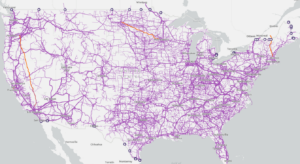
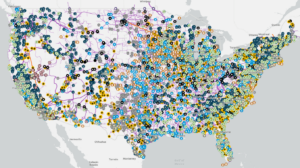
Electricity DistributionExamining the regions in more detail, Figure 13 shows some of the high voltage transmission lines, while Figure 14 overlays the powerplants on these transmission lines. Notice how they generally align. For instance, power generated in Seattle might end up in Los Angeles, and vice versa. We will discuss the significance of this alignment when we cover the topic of carbon emissions. Figure 13. US Transmission Grid (xvii)
Figure 14. US Power Plants Overlaid on US Transmission Grid (xviii)
Written by Operational Carbon Technical Lead Ilana Cember, PE, CEM |


Starwood Hotels & Resorts
1 Hotel Hanalei Bay Luxury Resort
Starwood Hotels & Resorts
1 Hotel Hanalei Bay Luxury Resort
Princeville, HI
Brightworks provided LEED certification management and energy services to support Starwood Hotels with the major renovation and rebranding of Kauai’s Princeville Hotel into a flagship 1 Hotel resort focused on sustainable hospitality and wellness. Brightworks collaborated with the design and construction team to incorporate innovative strategies that will save energy and water, improve operations, and protect local ecosystems. Brightworks also delivered comprehensive energy modeling services, which allowed the project team to identify energy conservation measures and evaluate options.
Practices Engaged:
Sustainable Built Environments
Industry Sectors:
Hotel
Building Types:
Hotels & Resorts

Gerding Edlen
5 MLK Apartments
Gerding Edlen
5 MLK Apartments
Portland, OR
This biophilically-designed tower achieved LEED Gold and Fitwel 1 Star certification while also featuring a resiliency program. The building offers 100,000 square feet of offices on lower floors and 220 residential units with landscaped terraces above.
Practices Engaged:
Sustainable Built Environments, Healthier Built Environments
Industry Sectors:
Residential
Building Types:
Luxury Residential
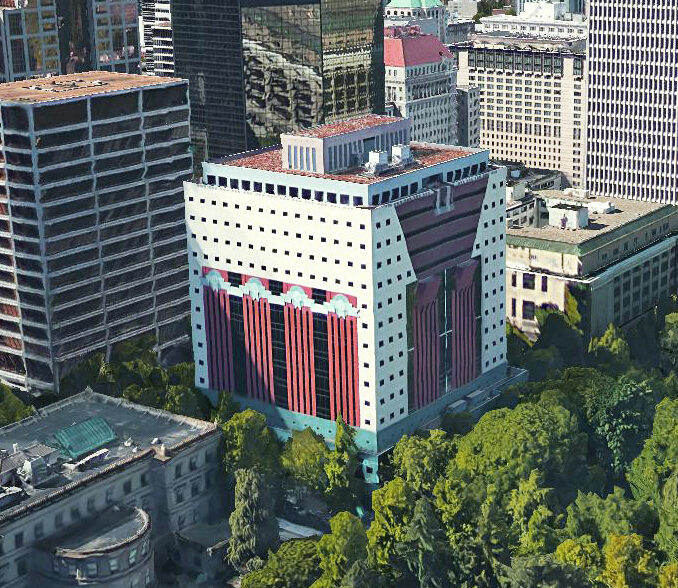
City of Portland
Case Study
City of Portland
Case Study
Practices Engaged:
Healthier Built Environments
Industry Sectors:
Corporate, Government, State & Local
Building Types:
Historic Buildings
Read more
ABB
North American GreenCRREM Assessments
ABB
North American GreenCRREM Assessments
Arkansas, California, Florida, Georgia, Michican, Missouri, Mississippi, North Carolina, New Jersey, New Mexico, Oklahoma, Pennsylvania, South Carolina, Tennessee, Texas, Virginia, Wisconsin, West Virginia
ABB is a global leader in industrial technology. Across 17 states, Brightworks conducted sustainability assessments on more than 50 buildings in ABB's North American portfolio, including manufacturing, office, and warehousing facilities. An extensive report providing a baseline assessment for each site helped ABB prioritize energy efficiency measures, budget for carbon reduction efforts, and calculate ROI as part of its GreenCRREM program.
Practices Engaged:
Sustainable Built Environments, Carbon, Energy
Industry Sectors:
Corporate, Manufacturing

Salesforce
Case Study
Salesforce
Case Study
This letter to the industry highlights the urgent need to address embodied carbon in MEP/IT/AV systems. While operational emissions have seen progress, this embodied carbon remains a challenge. This article reveals insights to guide the industry toward a 50% reduction by 2030 to stay on track for meeting net-zero carbon targets for 2050.
Practices Engaged:
ESG + Corporate Sustainability, Sustainable Built Environments, Carbon, Materials
Read more

AI Meets Lower Carbon Concrete
AI Meets Lower Carbon Concrete
Concrete accounts for 8% of global GHG emissions, which is more than every country except the US and China. Lower carbon concrete is a critical climate solution, but designing it isn’t simple. While AI offers promise, experts warn of its limitations in capturing real-world variables. This post explores why human expertise still leads the way, and how integrative strategies are reshaping concrete’s future.
Practices Engaged:
Materials
Read more
-
U.S. GSA Diplomatic Security OfficeDiplomatic Security Office | Seattle, WA
-
U.S. Social Security Administration OfficeVan Nuys Office | CA