Part III: Grid Decarbonization
Everything You Need To Know About How Electricity Works ...
... but may have been too embarrassed to ask
- Carbon
- ESG + Corporate Sustainability
- Energy
Practices Engaged

Grid Decarbonization
Part III of IV: Carbon Emissions & Emissions Reduction

Welcome to a 4-part series where our Operational Carbon Technical Lead and Licensed Engineer, Ilana Cember, dives into:“(Almost) Everything You Wanted to Know About Electricity But Are Embarrassed to Ask”Understanding the basics of electricity generation, distribution, purchasing, greenhouse gas emissions, and the utility grids is key to understanding how we change any of those to keep our global commitment and meet the Paris Climate Accord. We will go into the “why” for each of these topics as they are covered. TOPICS WE WILL COVER
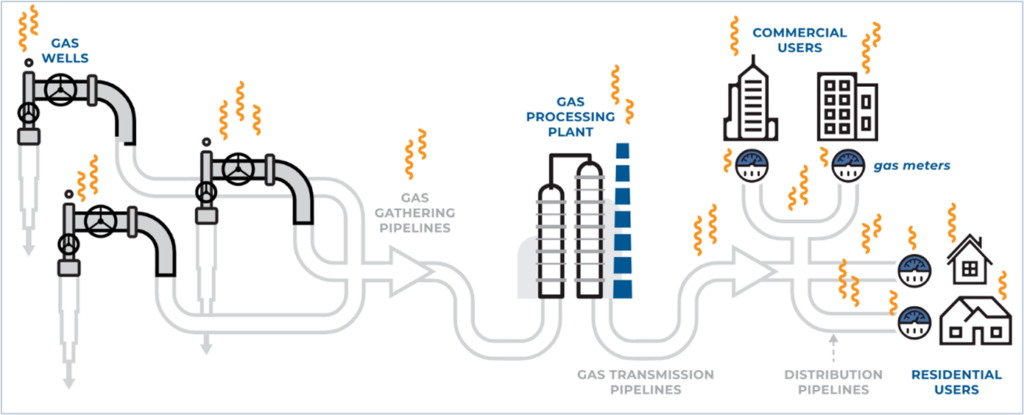
Part III: Carbon emissions and decarbonizationWHY?If the goal is to meet the Paris Climate Accords commitments, we must focus on carbon emissions. Different power generation fuels create different amounts of carbon emissions. Fossil fuels (coal, petroleum/oil, natural gas) are hydrocarbons – consisting of hydrogen and carbon molecules in different forms When burned to generate electricity, these fuels react with air to form carbon dioxide, a greenhouse gas, along with smog and particulates from incomplete combustion or contaminants. In addition, practically every step in the process of utilizing fossil fuels releases greenhouse gases into the atmosphere, accelerating global warming (xxvii) as shown in Figure 21. Leakage rates vary widely depending on the source and are estimated between 1% and 8% (xxviii). (“End use” encompasses residential natural gas equipment or power plants.)
Figure 21. Methane Leakage in Natural Gas Systems (xxx)
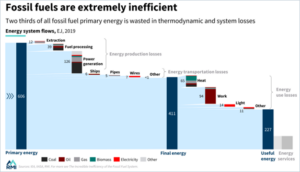
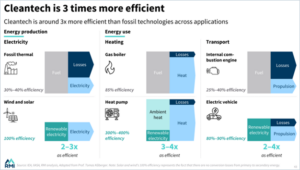
This is in addition to the incredible system losses through the process as shown below. Only 37% of the fossil fuel energy in the ground becomes useful energy. Solar, wind, and electrification all reduce energy losses from generation and end-use.(xxxi) Figure 22. Fossil Fuels are Extremely Inefficient (xxxi)
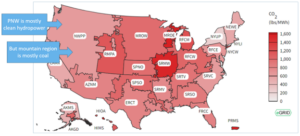
Alternatively, even accounting for embodied carbon emissions (the greenhouse gas emissions associated with manufacturing, transportation, etc), renewable energy like solar photovoltaic and wind energy are significantly less polluting and greenhouse gas intensive than fossil fuels, sometimes by orders of magnitude. (xxxiii) Note that greenhouse gas is the general term for all the chemicals that contribute to global warming. For calculating global warming impacts, the greenhouse gas impact is converted into a carbon dioxide (CO2) equivalent (CO2e). Methane has a global warming potential of 25, meaning it has 25 times the impact on global warming as CO2. “Greenhouse gas” and “carbon” are often used interchangeably. Renewable Energy ProcurementReferring to the EGRID map below in Figure 23, different regions exhibit varying carbon intensities, which measure the amount of greenhouse gas produced per unit of electricity generated, as shown in Figure 20 (back in Part II). Grids with higher carbon intensities rely more on fossil fuels, resulting in greater greenhouse gas emissions. Conversely, grids that utilize more renewable energy sources, such as solar photovoltaic, wind, and hydropower, produce fewer greenhouse gas emissions. Grid emissions essentially represent the average emissions from power plants within a region. For instance, looking at NWPP (Northwest Power Pool) region, the pacific northwest gets most of its energy from hydropower, a carbon-free energy source, while the mountain region still relies on coal. When calculating a facility’s electricity carbon emissions (scope 2 location-based), the calculations take this into account. Figure 23. Carbon Intensity by EGRID Region (xxxiv)
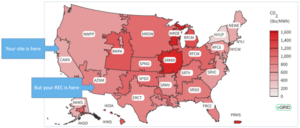
This also complicates the impact from renewable energy certificates (RECs). Typically customers buy RECs on the open market, regardless of their location. As a result, the renewable energy generated may not be in the same region as the facility for which the RECs are purchased.
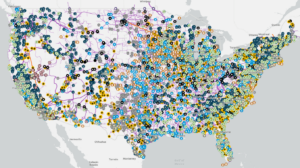
Conversely, the electricity a site uses might not be generated locally, as seen in the power distribution map. Figure 14. Power Distribution Map (xxxiii)
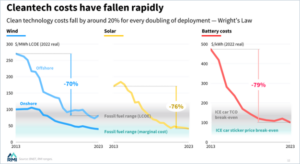
In summary, the electricity you buy on the open market, particularly RECs, is not the electricity you receive. Recent research indicates that market procurement of renewables does not increase the amount of renewable generation connected to the grid. (xxxii) Starting in 2021-2022, the cost of utility solar is about the same price as fossil fuel, meaning it now makes economic sense to install solar over fossil fuel regardless of carbon emissions (Figure 24). (xxxiii) Thus calculating scope 2 electricity emissions and applying the REC purchases does not necessarily show an accurate portrayal of a facility’s carbon footprint, and may be artificially lowering calculated emissions. Figure 24. Cleantech costs have fallen rapidly (xxxiv)
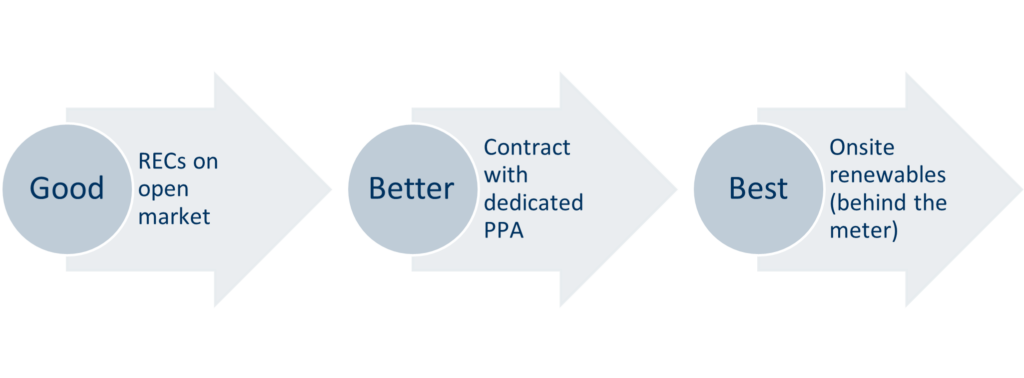
Therefore, when working on decarbonization strategies, Brightworks Sustainability recommends thoughtful usage of renewable energy procurement using the below “good/better/best” model:
In summary: |


Starwood Hotels & Resorts
1 Hotel Hanalei Bay Luxury Resort
Starwood Hotels & Resorts
1 Hotel Hanalei Bay Luxury Resort
Princeville, HI
Brightworks provided LEED certification management and energy services to support Starwood Hotels with the major renovation and rebranding of Kauai’s Princeville Hotel into a flagship 1 Hotel resort focused on sustainable hospitality and wellness. Brightworks collaborated with the design and construction team to incorporate innovative strategies that will save energy and water, improve operations, and protect local ecosystems. Brightworks also delivered comprehensive energy modeling services, which allowed the project team to identify energy conservation measures and evaluate options.
Practices Engaged:
Sustainable Built Environments
Industry Sectors:
Hotel
Building Types:
Hotels & Resorts

Gerding Edlen
5 MLK Apartments
Gerding Edlen
5 MLK Apartments
Portland, OR
This biophilically-designed tower achieved LEED Gold and Fitwel 1 Star certification while also featuring a resiliency program. The building offers 100,000 square feet of offices on lower floors and 220 residential units with landscaped terraces above.
Practices Engaged:
Sustainable Built Environments, Healthier Built Environments
Industry Sectors:
Residential
Building Types:
Luxury Residential
City of Portland
Case Study
City of Portland
Case Study
Practices Engaged:
Healthier Built Environments
Industry Sectors:
Corporate, Government, State & Local
Building Types:
Historic Buildings
Read more
ABB
North American GreenCRREM Assessments
ABB
North American GreenCRREM Assessments
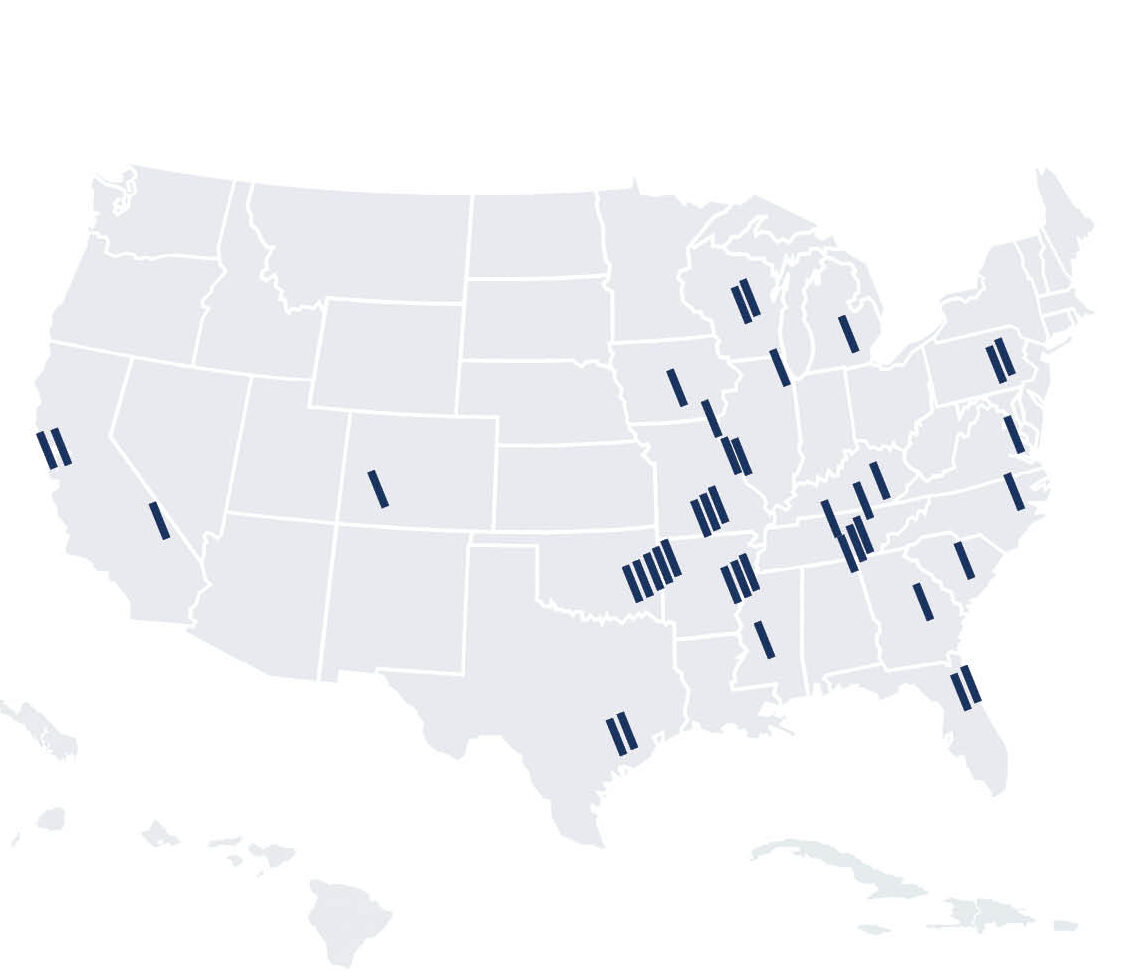
Arkansas, California, Florida, Georgia, Michican, Missouri, Mississippi, North Carolina, New Jersey, New Mexico, Oklahoma, Pennsylvania, South Carolina, Tennessee, Texas, Virginia, Wisconsin, West Virginia
ABB is a global leader in industrial technology. Across 17 states, Brightworks conducted sustainability assessments on more than 50 buildings in ABB's North American portfolio, including manufacturing, office, and warehousing facilities. An extensive report providing a baseline assessment for each site helped ABB prioritize energy efficiency measures, budget for carbon reduction efforts, and calculate ROI as part of its GreenCRREM program.
Practices Engaged:
Sustainable Built Environments, Carbon, Energy
Industry Sectors:
Corporate, Manufacturing

Salesforce
Case Study
Salesforce
Case Study
This letter to the industry highlights the urgent need to address embodied carbon in MEP/IT/AV systems. While operational emissions have seen progress, this embodied carbon remains a challenge. This article reveals insights to guide the industry toward a 50% reduction by 2030 to stay on track for meeting net-zero carbon targets for 2050.
Practices Engaged:
ESG + Corporate Sustainability, Sustainable Built Environments, Carbon, Materials
Read more

AI Meets Lower Carbon Concrete
AI Meets Lower Carbon Concrete
Concrete accounts for 8% of global GHG emissions, which is more than every country except the US and China. Lower carbon concrete is a critical climate solution, but designing it isn’t simple. While AI offers promise, experts warn of its limitations in capturing real-world variables. This post explores why human expertise still leads the way, and how integrative strategies are reshaping concrete’s future.
Practices Engaged:
Materials
Read more
-
U.S. GSA Diplomatic Security OfficeDiplomatic Security Office | Seattle, WA
-
U.S. Social Security Administration OfficeVan Nuys Office | CA