Case Study
Salesforce
Achieving 2030 Goals in Emissions Reduction Requires Reuse
A Letter to the Industry
- Carbon
- ESG + Corporate Sustainability
- Materials
- Sustainable Built Environments
Practices Engaged

|
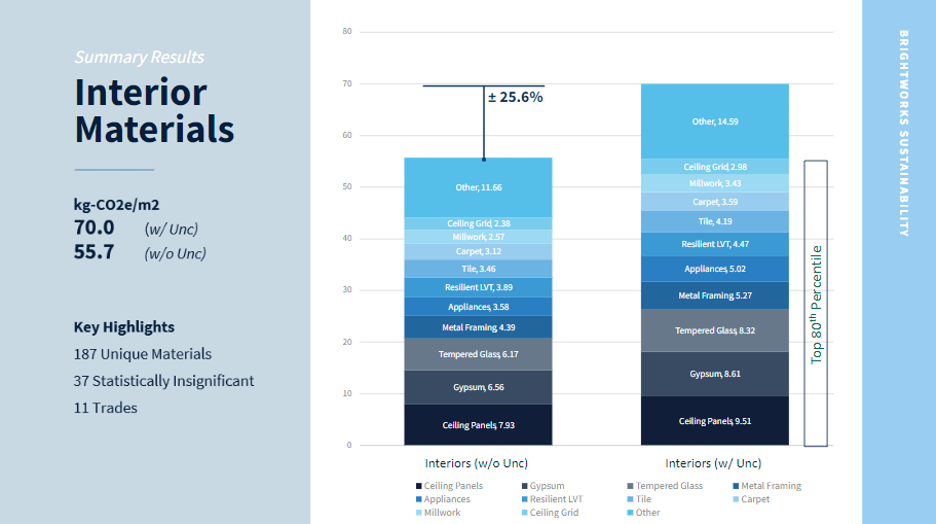
In this letter to the industry, Jeffery Frost, Brightworks Sustainability, highlights the urgent need to properly address carbon emissions in the building sector. While operational emissions have seen progress, embodied carbon—especially from overlooked areas like MEP/IT/AV systems, and furniture—remains a challenge. This article summarizes the application of the WRI GHG Protocol for Embodied Emissions going beyond traditional WBLCA calculations and revealing insights to guide the industry toward a 50% reduction by 2030 to stay on track for meeting net-zero carbon targets for 2050. IntroductionIt is well understood that the construction and operation of buildings represents over 40% of annual carbon emissions, and these emissions are typically divided and measured as operational emissions (from energy use) and embodied carbon emissions (from the manufacturer of the materials required to build). According to the International Energy Agency, these emissions will need to fall by 50% by 2030 to stay on track for meeting net zero carbon targets for 2050. To date, the building sector has found many innovative ways to address operational emissions while emissions from embodied carbon have largely been ‘partial’ in nature, meaning the bulk of our industry work has been on parts of a whole—materials, like concrete, structures, roofing, siding, glazing, along with interior walls, glass and select finishes like flooring, ceilings and doors. What is missing from this analysis, confusingly referred to as a Whole-Building Life Cycle Analysis (WBLCA), are the remaining construction materials, all the MEP (Mechanical, Electrical, Plumbing), IT (Internet Technology), and AV (Audio/Video) systems, and all the furniture. The emissions from these systems have gone unmeasured, or partially measured with inadequate methodologies—until now. Project BackgroundStarting in 2019, Salesforce, a cloud-based software company, wanted to better understand the total embodied carbon impacts of their growing real estate portfolio, inclusive of these often-missed emissions. At the direction of their Real Estate and Sustainability teams, Brightworks Sustainability and WAP Sustainability began developing a methodology to determine uncertainty and define a process for using proxy embodied carbon estimates in our work. In other words, to determine embodied carbon factors for a wide range of products; those with Environmental Product Declarations (EPD) and those without. The outcome of this work resulted in some important findings, namely the publication of the World Resource Institute (WRI) Greenhouse Gas (GHG) Protocol Sector Supplement, formally approved in November 2021 by the Greenhouse Gas Protocol. Note to the reader: If you would like to read more about Salesforce and their commitments to climate change, you can visit the link here. Salesforce design materials have been optimized for many years to reduce impacts and quantity of materials used. The numbers represented here are not typical for all tenant improvements. In addition, the values highlighted here are ‘baseline’ values and do not reflect reductions that have taken place over the intervening years to support Salesforce’s commitments. This methodology was then applied to a Salesforce project, through all phases of work. The project was a small two-story tenant improvement (TI) Salesforce workplace. Salesforce spaces are consistent from project to project in alignment with their ‘One Salesforce’ philosophy and are highly refined with minimal material usage and optimized products. This would make translating embodied carbon results from one project to a portfolio much easier. To move forward, a complete bill-of-materials (BOM) was needed to understand the extent of materials used. The contractor and subcontractors were informed of collection needs. To save time and make this effort easier for the subcontractors, the team asked for purchased quantities, no special exclusions; if they purchased it for the project, we wanted include it in our ‘collection’. These quantities naturally included all overage/waste, a piece of the puzzle that’s challenging to estimate from drawings or BIM models. With little pushback, we captured every material from every subcontractor. This is significant and speaks to the progress we made—five years ago, it would have been time-intensive to work with subcontractors and manufacturers to seek this information. Embodied Carbon ResultsINTERIORS: The construction materials portion of the study was completed in 2021. The study indicated construction materials (everything inside the space that was not furniture or MEP/ITAV related) resulted in an embodied carbon factor of 70 kg-CO2e/m2 with uncertainty. The following chart captures the total emissions from the 187 unique interior materials used and highlights product types making up the top 80% of emissions:
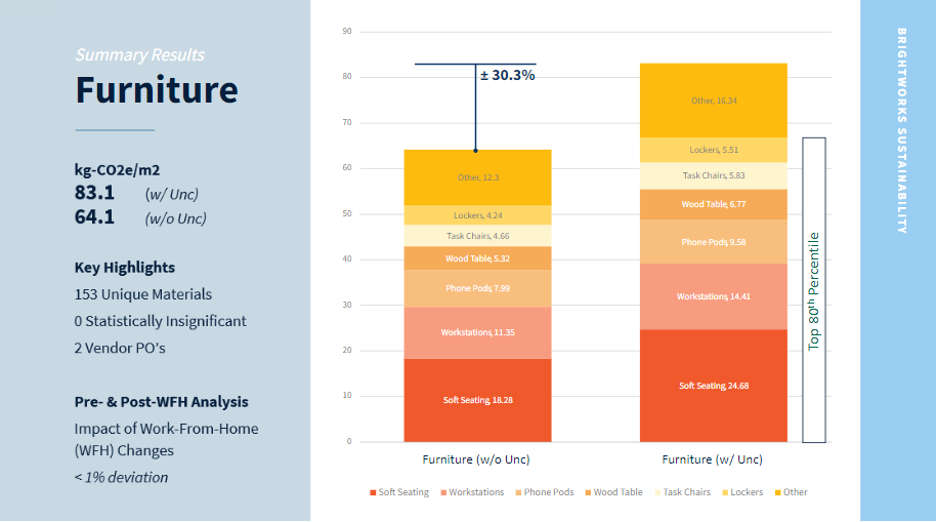
As shown, Ceiling Panels, Gypsum, and Tempered Glass made up 37% of the embodied emissions from interior materials. These included two different Ceiling Panel products and a variety of Gypsum types and thicknesses including regular, type-X, and moisture resistant. It’s worth noting that the carpet used throughout Salesforce projects was already the lowest carbon option available at the time. Many of the other materials noted in the 80th percentile have improved either their carbon footprints or created more accurate EPDs since this study. FURNITURE: In 2022, the furniture portion of the study was completed and resulted in an embodied carbon factor of 83.1 kg-CO2e/m2 with uncertainty. The furniture results, which we expected to be lower, came in 18% higher than the construction materials for the same space. In 2023, we repeated the furniture assessment on a three-floor project and found the results to be statistically insignificant, varying by less than 1%, despite the programmatic changes reflecting a post-COVID work-from-home environment. The following chart captures the total emissions from the 153 unique furniture materials and highlights product types making up the top 80% of emissions:
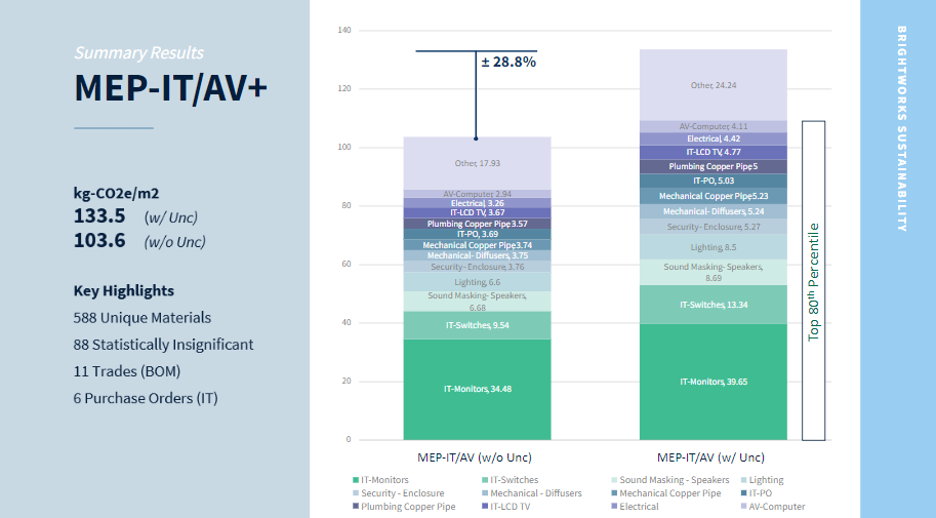
As shown, Soft Seating, Workstations, and Phone Pods made up roughly 58% of the embodied emissions of furniture. Soft Seating is a broad category that includes 303 pieces across 23 unique products, mostly custom furniture and catalog seating. It is worth noting that 55% of the emissions for Soft Seating originate from 15 modular pieces of custom furniture. The workstations category included height-adjustable desks, divider systems, and cubbies (most with custom lockable wood lockers). The results point to the incredible impacts and opportunity for reductions that Soft Seating has, especially for custom products where the use of alternative, bio-based materials can be readily explored. MEP/IT/AV: In 2023, the MEP/IT/AV portion of the study was completed and resulted in an embodied carbon factor of 133.5 kg-CO2e/m2 with uncertainty. The results were almost 2x what we anticipated (68 kg) when we began the assessment work. As a reminder, this included all components inside of a blank shell space— not just MEP/IT/AV systems, but also Fire, Security, and Acoustic—everything down to switchboxes, cover plates, registers, IT switches, strobes, and panels. This allowed us to capture as close to a true accounting of the total carbon of the space as possible. The following chart captures the total emissions from the 588 unique MEP/IT/AV materials used and highlights product types making up the top 80% of emissions:
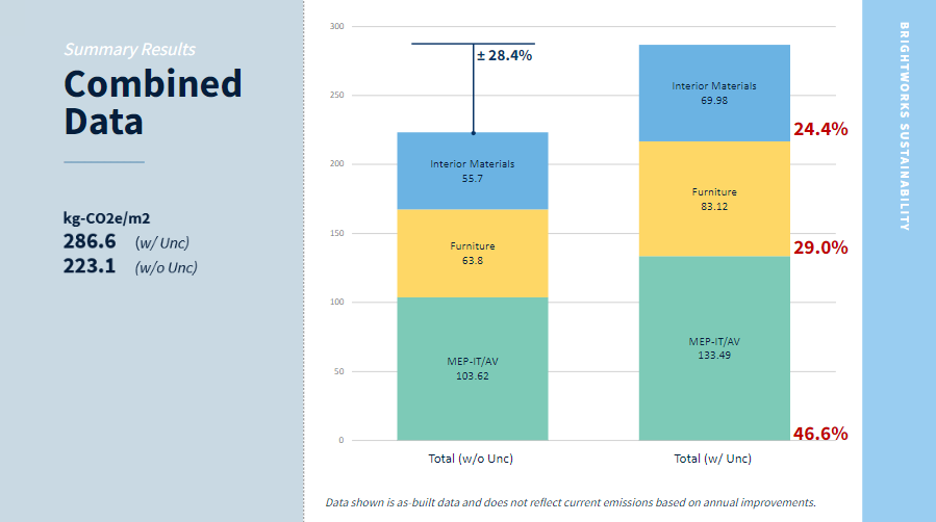
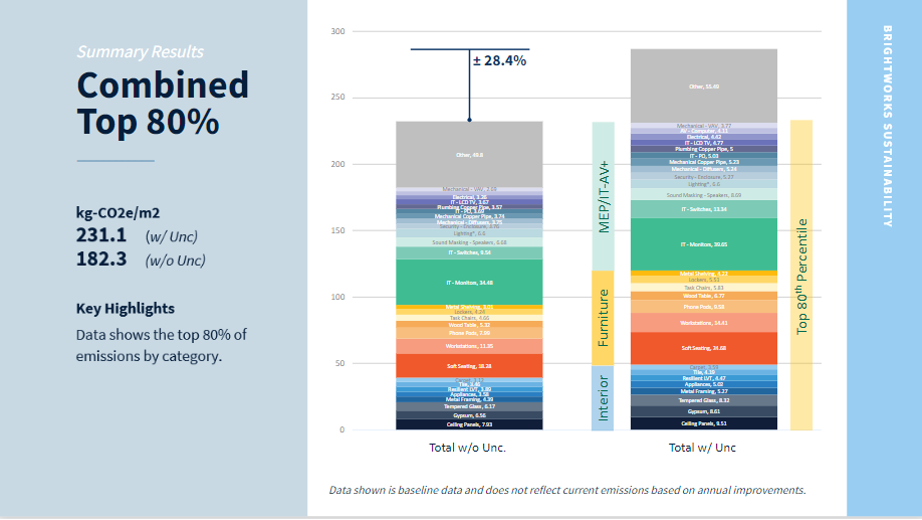
As shown, computer monitors made up roughly 30% of emissions calculated for this category. Each desk had two monitors, resulting in roughly 290 units across the studied space. Excitingly, the monitors from Dell had a product specific EPD available, which provided a high level of confidence in the embodied carbon factors but also surprised us at the total impact across the whole study; resulting in just over 13.8% across all materials. IT switches made up the next 10% of the MEP category, comprised of over 355 installed pieces. Specifically, three switches with ‘racks’ made up 28% of IT-Switch emissions, the balance coming from parts installed inside those racks. In all, there were 588 unique products identified. Overall Impacts and AnalysisIn aggregate, the resulting embodied emission factor including all materials was 287 kg-CO2e/m2. These results include an uncertainty factor which is an accumulative uncertainty for each material and represents the total project uncertainty. In this study, that uncertainty was 28.4% as seen in chart below. Therefore, the GWP factor without uncertainty was 223 kg-CO2e/m2. The following chart captures the total emissions across all material categories studied and their relative emissions compared to each other:
The results show that MEP/IT/AV made up 46.6% of total embodied carbon emissions of the project. Furniture represented 29% while interior materials was 24.4%. The MEP/IT/AV results were certainly higher than our team expected. But the results overall, given the detail of this study, help to paint a picture of ‘actual’ embodied carbon for TI spaces that hasn’t been fully measured or understood before. The next chart aggregates the 80th percentile from each product group and begins to offer context for how different product types compare across the entire project. An example being that the relative impact of metal framing and appliances (both roughly 5 kg-CO2e/m2) are like that of lockers and task chairs (both roughly 5 kg-CO2e/m2) and a handful of MEP/IT items, IT-PO (misc. office technology), Mechanical Copper, Plumbing Copper, and Mechanical Diffusers (all roughly 5 kg/m2). The following chart captures the total emissions across all material categories studied with a detailed breakdown of GWP factors by type:
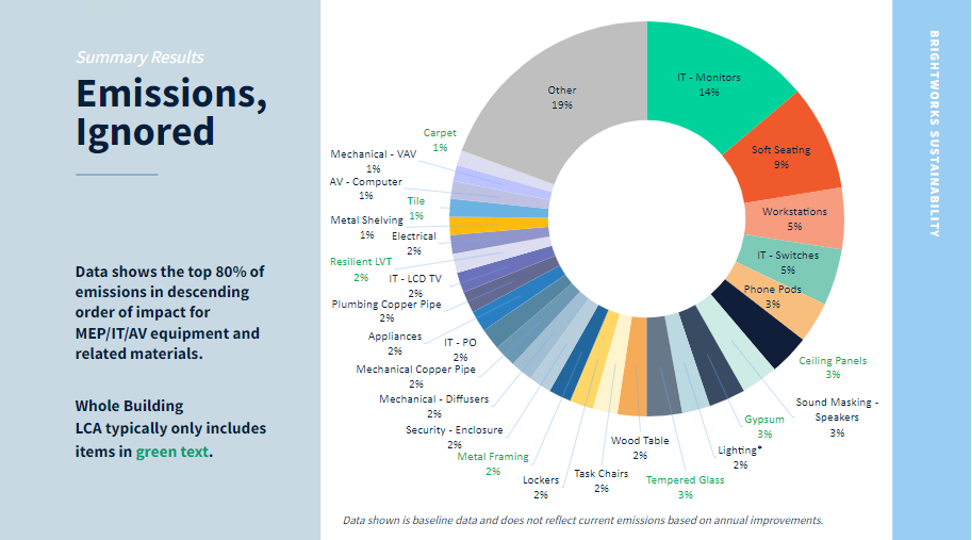
What’s remarkable to us was seeing that most of our WBLCA activities, relative to non-structural materials, are all at the bottom ‘blue’ section of this chart. Much of our optimization efforts currently are focused on ~15% of total emissions. If we include workstations and chairs, often considered when exploring furniture emissions reductions, this increases to ~ 22%, which is necessary, but not sufficient to achieve our client’s goal. The following chart demonstrates what is typically excluded from WBLCA:
Comparing ResultsLet’s look at these results alongside two studies done by Carbon Leadership Forum (CLF) for Tenant Improvement projects, and see how our results compare. The CLF’s research, released in 2019, has two components, one for MEP and one for TI materials. These studies looked at five different building projects, not all of which were tenant improvement projects, according to the authors, and relied on material take-offs from drawings as provided by industry advisors. Immediately, it should be noted that our study relied on actual purchased quantities, including every material purchased by each subcontractor, not relying on take-offs. In addition, the CLF studies used proxy embodied carbon factors for materials that without EPDs they acknowledge may not be representative of the product installed. Whereas our team, with WAP’s LCA expertise, took the time to identify representative data for each unique piece studied; in some cases, building data using background data sets. The range of GWP/m2 from the CLF study was between 45 and 135 kg CO2e/m2 for TI materials and between 40 and 75 kg-CO2e/m2 for MEP materials. These were just A-stage impacts and didn’t include uncertainty. Our results show that TI materials, in total, were roughly 56 kg/ m2 without uncertainty, falling at the bottom of the CLF study range (45-135) but included more accurate quantities, more accurate data, and more products/materials. Our MEP/IT/AV results were 104 kg-CO2e/m2 without uncertainty, far exceeding the range identified in the CLF study range (40-70). This is roughly a 48% to 260% difference increase but included more products, more systems, and more materials, often not captured in drawing sets. It should be acknowledged that at the time of the CLF study, very little MEP/IT/AV LCA or EPD data was available. While there is still a dearth of data available in those sectors, our study of MEP/IT/AV benefited from the tremendous growth in LCA/EPD/PEP data in those sectors globally. We’ll save some additional comparisons for future posts. One we’ve been exploring further is how these results compare to the stock of TI-WBLCA results we have across Brightworks’ own work, and how these results compare to Core & Shell WBLCA results. Another is the impact of TI’s overtime, assuming a five-seven year timeline for any additional work, or the typical redesign that occurs in tenant interior projects—are TI emissions, over multiple renovations, as impactful as Core & Shell emissions? To be continued. Meeting 50-by-30 TargetsNow, let’s return to our original problem statement, which was: what does it mean to achieve a 50% reduction in Embodied Carbon emissions by 2030? If we use the updated baseline value from this study, 287 kg/m2, then a 50% reduction would mean we need to get to 143.5 kg/m2 by 2030. What is the pathway to getting there? We broke this down a variety of ways but largely landed on the following ‘assumptions’ to support what needs to be done. Assumption #1: The market will see a 10% reduction in overall embodied carbon emissions from grid scale energy efficiencies that reduce overall manufacturing emissions. Assumption #2: The ‘building-industry’ (designers, architects, engineers) currently have very little control over what MEP/IT/AV materials get deployed. Assumption #3: MEP/IT/AV markets, having only recently begun their LCA/EPD development work, will take time to begin decarbonization efforts. Therefore, we conservatively project a 25% reduction in GWP across the sector by 2030. We hope for more reductions, but the follow factors suggest even this might be a challenge:
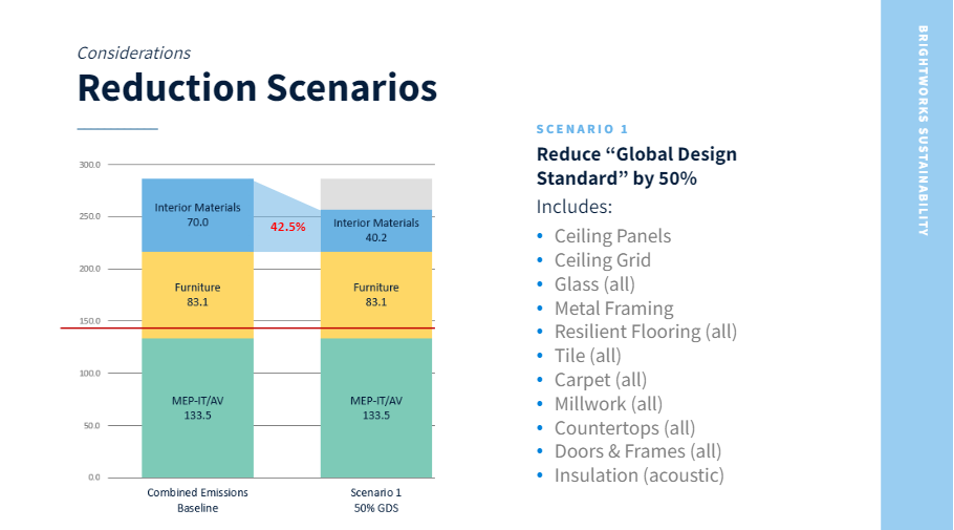
How To Reach Our 50% Emissions Reduction Goal? With these assumptions called out, where does this leave us? Our target is 143.5 kg/m2. If we just reduced our emissions from tenant improvement products typically called out in a WBLCA by 50%, this would get us to ~257 kg/m2. The following chart shows a 50% reduction in WBLCA interior materials:
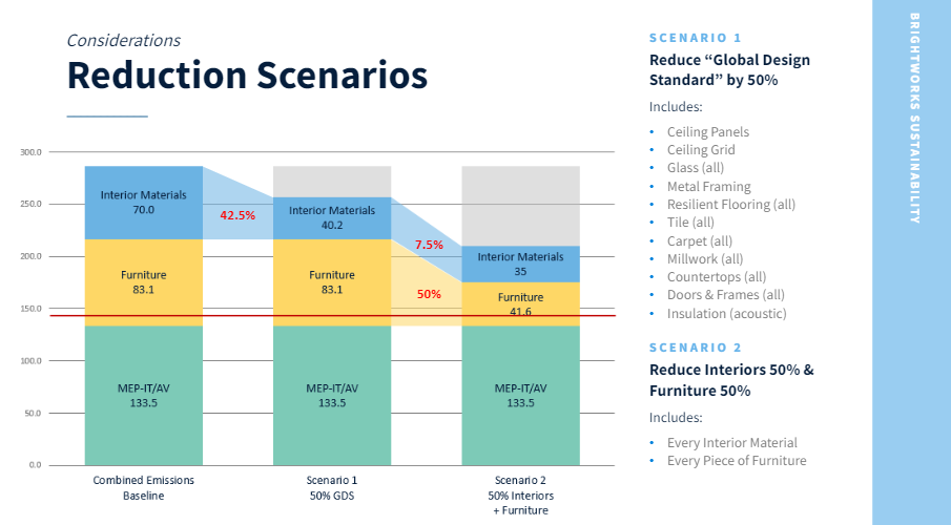
If we reduced all Interior Materials by 50% (including everything measured in our study) and we reduced furniture emissions by 50%, this would get to ~210 kg/m2. The following chart shows a 50% reduction in ALL interior materials and 50% in furniture:
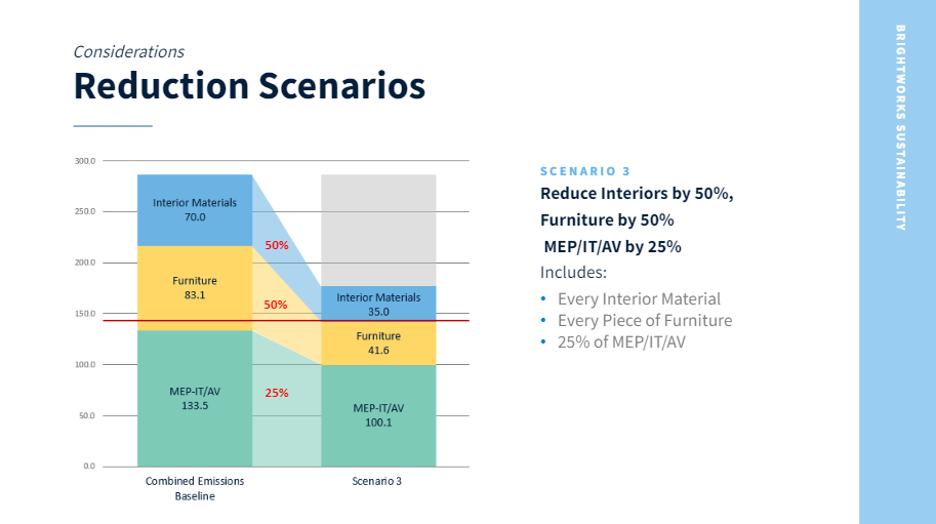
If we reduced all interior materials by 50%, furniture by 50%, and included our MEP/IT/AV reductions of 25% (as explained above), this would ONLY get us to ~177 kg/m2. The following chart shows a 50% reduction in ALL interior materials, a 50% in furniture, and a 25% reduction in MEP/IT/AV:
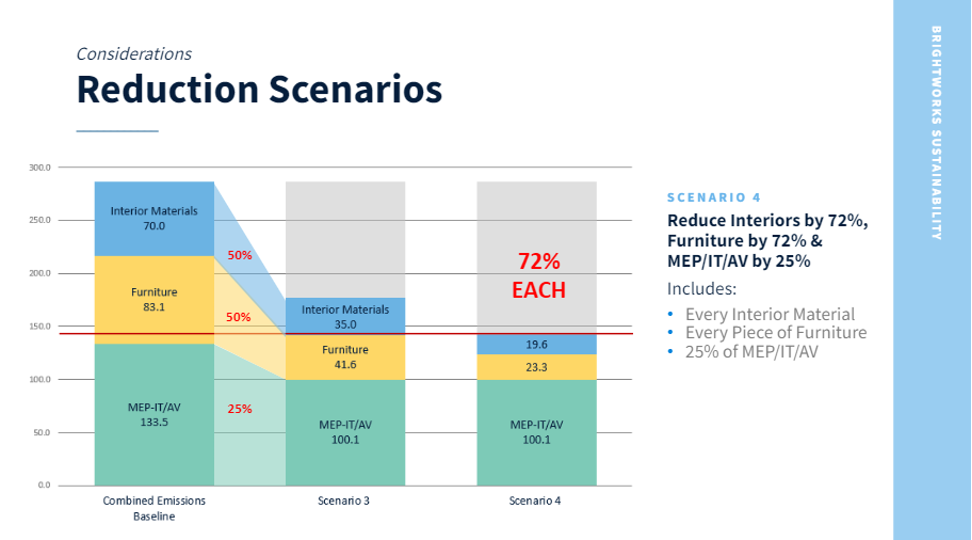
Even with all these reductions, we’re still falling short of our 50% reduction target of 143.5 kg/m2 by ~20%. Given the assumptions noted above, as designers, much of our ‘design influence’ comes from the TI and furniture materials we select and we’re likely NOT going to see higher GWP reductions in the MEP/IT/AV sectors beyond our 25% estimate. So where does that leave us? What is the reduction we need to see to get to 143.5 kg/m2 target? To get there, again assuming a hopeful 25% reduction in MEP/IT/AV, we’ll also need to achieve a 72% Reduction in GWP for both tenant improvement materials and furniture. The following chart shows a 72% reduction in ALL interior materials, a 72% reduction in furniture, and a 25% reduction in MEP/IT/AV to achieve a total GWP reduction of 50%, by 2030, in line with IPCC guidance:
Ongoing Market ChallengesIn addition to measuring our emissions effectively to make the reductions we need; we have some additional industry challenges that will ‘cloud’ or ‘block’ our progress towards getting to these reductions. Industry Challenges: Interiors First, designers currently live in a world of endless possibilities with a rainbow of options, not unlike walking into a candy store. A transition towards low-carbon, bio-based materials will challenge designers to work creatively with a less diverse palette while still creating beautiful experiences. In my old natural building days, we’d say, “there are no ugly materials, just ugly ways of using them.” Our friends at Habitable have a way a characterizing this that we appreciate: “’Healthier spaces’ is very much like healthy eating; while the whole grocery store may be available for our deepest dietary pleasures, only the perimeter has the foods that support our long-term health” (the middle is usually all the processed foods). This concept is not unlike many artists who work with limited material palettes. Another is our over-reliance on oil-derived products. Specifically, the plastic and resinous revolution we’ve seen over the last few decades that is a barrier to progress. Many owners and designers feel compelled to specify ‘bullet-proof’ materials in many applications where it actually makes long-term maintenance more difficult or where less material is the better solution (for instance, Resinous Terrazzo Floors versus dense, hard-polished concrete; and NO, I don’t mean ‘polished’ using a coating, but through surface refinement). Luckily, we’re seeing the emergence of bio-based alternatives to these products emerging which is at least moving in the right direction for health and carbon—but more work is needed to eliminate them from our indoor environment. Additionally, specifications that require three products for every product type are the slow path to progress and does nothing to support the usage of innovative low-carbon, bio-based products that should be PREFERRED for many project types (e.g., schools, daycares, affordable housing, hospitals, government facilities, etc.). This is especially true in the world of corporate consolidation that often leads to two-three suppliers in any space, often with one product being the best for the climate, and health of occupants. This rewards the ‘cheapest’ products first, which are often cheap because they are laced with chemicals that are harmful to building occupants. Bullet-proof they might be, but safe and circular, they are not. Lastly, but certainly not the only remaining challenge, we have yet to tap our full potential for salvage and reuse opportunities. There is so much that has yet to emerge to support the reuse economy and the availability of salvaged and reused materials. The easiest place to start is a design assessment of the materials and construction practices of your interior spaces. Are there any materials being used that can’t be reused or salvaged? Why? Would they be destroyed during removal, not have future value, can’t be sent back to the manufacturer for re-integration? What could be done to change that? Right now, when owners leave a tenant space at the end of its lease period, many, if not all, of the materials get sent to landfills or MRFs. Metals may be scrapped out to be recycled but the rest is often lost. This is the low-cost pathway for many. More progressive owners will work with donation services to attempt some landfill avoidance, but this is often limited to furniture and does not address the other 90% of materials. Deconstruction practices will be a critical part of the salvage and reuse economy and will require investment. It’s going to be challenging to establish a functional reuse market to rival the market for new things, but it is necessary if we wish to maintain only a 1.5 or even 2 degree Celsius increase in the global climate. Industry Challenges: Furniture To continue our summary of these challenges, let’s look at furniture specifically. Some commercial and many retail furniture pieces have been in a race to be ‘cost-competitive,’ leading to the use of cheap synthetic materials that often lack end-of-life value, cannot be easily recycled or separated, and fall apart quickly, eliminating any residual value a better-quality piece might have had. (Read: Cheap: The High Cost of Discount Culture by Ellen Ruppel Shell). Durability, health, and carbon impacts should be among the core values for companies who claim to care about their employees when selecting furniture. Another challenge is that too many architects, engineers, contractors, and manufacturers shirk ‘their’ responsibility to innovate and lead on issues of the day that could move the needle on emissions and circularity. Some point to lack of customer ‘demand’ for not offering either market solutions, such as furniture-as-a-service, or for materials innovations, such as remanufacturing or even innovative materials. This must stop. There are thousands of decisions we each make every day that aren’t driven by client demands. Right now, the planet demands leadership in taking the impact of their goods seriously and offering solutions to reduce them. This includes social considerations of where these products are made and the impacts they have on those communities. Owners and lessees have a large role to play in some of our furniture challenges. Little to no consideration is placed on the value of ‘furniture’ at end of use. Most spaces are left or turned over for landlords to deal with, often lacking any of the design specifications to properly determine market value. Progressive companies today might look at donation services for furniture, ensuring some get a second life, but often just delay the inevitable trip to the landfill. Frequently, there isn’t even a budget to consider alternative scenarios. Unfortunately, furniture is not ‘low-hanging-fruit’—these ecosystems require investments in time and services to see them implemented correctly. The narrative needs to shift from furniture as a ‘depreciated-asset’ (one with no-book-value) to one of residual-value. And if not, then not taking ownership of the furniture is the better model, either as-a-service or leased asset where the manufacturer manages recovery. The ecosystem of furniture reuse is still developing as tools, services, and organizations emerge both globally and locally. Asset management is often missing or lacking, which makes knowing what assets could be reused tricky. Logistics of moving from site to site either for internal reuse or resale/donation is costly, not always timely, or mired in perceived legal risks. Short-term storage of pieces that could be reused adds costs and risks. Market-facing platforms for the reuse of furniture are available but vary widely in their function, quality and capabilities, and add more cost to the equation. And, as noted already, these challenges remain if owners and lessees aren’t willing to invest in these ecosystems and new markets. Getting to 72% Emissions ReductionWhat Does It Mean to Reduce Interiors by 72%? The significant advantage we have in making reductions to interior materials, as opposed to furniture and AV/IT materials, is we already have a highly engaged sector of incredible professionals, with plenty of low-carbon materials available, who are ready and able to implement this change. There are also many bio-based, low-carbon alternatives available to support this goal. Of all our goals, this is the one I believe will be the ‘easiest’ to achieve by 2030. Here are five solutions we can start implementing right now, on every project, at every budget. There may be challenges, but they will create a meaningful impact to our emissions. 1. It’s basic but bears repeating: Less is More. Use less. Maximize material potential. Question finishes that may be installed over other, potentially suitable finishes. Repair what you have. Question whether you need that new computer, new set of chairs, new couch. 2. Design Challenges: Using creative ‘challenges’ to solve a climate challenge, a social challenge, a circularity challenge, or all the above, creates the stories that inspire employees.
3. Design Assessment: Complete a DD-stage assessment to review what materials being considered will not be able to be recycled, salvaged, or reused at the end of the project’s life. Document why and what options could be taken to change those outcomes. What barriers or pieces of information are missing to make those changes? 4. Create operation and maintenance manuals and hold the team accountable to following them. Ensure OEM Manuals include information about the products used and their end-of-use guidance, like disassembly instructions, reuse/recycle information, design specifications, and warranties. 5. Reward these behaviors in your employees and offer graduated sanctions to hold violators of these policies accountable. What Does It Mean to Reduce Furniture by 72%? Furniture requires a lot of support to see the kind of changes needed to hit a 72% reduction. Much of this reduction can’t be achieved just with FSC woods, recycled steel, or changing to low-carbon fabrics. It will require other innovations that are not ‘cheap’ or easy. But hitting 72% is possible when we empower and invest in the reuse ecosystem and consider bio-based solutions that are on the market today. Here are a few things that can be explored to move the needle. 1. Owners need to spend money to better manage their furniture assets. Setting this up is easier day-one than waiting until year five to implement. Tools today can connect directly to your distributors and capture a full bill-of-materials including every specification detail that will be valuable for future reuse or resale—just ask. Many of these details are still available from projects three-seven years ago, so it’s often a quick way to start the inventory process.
2. Design Challenges: Challenge teams to integrate ‘reused furniture.’ The scale of the challenge can vary and will depend on local availability, but every piece is an opportunity to tell a story. 3. Design Assessment: Just like the DD-stage assessment for interiors, looking at your furniture pieces after they have been selected and determine with the owner’s design teams which pieces are ripe for reuse and which will have little value during a second life. What could be done differently to change that? 4. Bio-based materials are becoming more readily available for furniture. Companies like ENKEV are bringing many solutions to the market. 5. Ask manufacturers about product-as-a-service options that they have available. Humanscale has been piloting programs to better understand potential for carbon reduction and logistics of how much it costs compared to buying for owners. Opening our minds to these approaches, even if for a select set of furniture pieces, is a great place to start. Desks, chairs, markerboards, and dividers all have potential. 6. Ask manufacturers about remanufacture options that they have available. These are ‘like-new’ reused pieces on whole or those with some components that are reused among others that are new. Davies Office furniture has been a leader in remanufacturing for decades. And recently, Steelcase started remanufacturing some components, making these pieces available for purchase. So, I challenge you—in your next building, your next TI, your next acquisition: What tangible steps are you taking to change the conversation away from the status quo? Share the content of this study, and the solutions you can be part of, with your clients, with leadership, with investors, to highlight the urgency our industry faces and the importance of taking action, however small, to change the narrative and the outcome. We can’t afford to sit back and hope for the best. We need to actively participate in our daily relationships among the industry to make this shift. This is a challenge of creativity, of exploring new opportunities, of inspiring further action and celebrating and encouraging innovation, and we literally already have what we need to meet it. Written by Jeffery Frost, Materials Technical Lead, Brightworks Sustainability. Edited for clarity by Sunni Wissmer, Market Engagement Lead, Brightworks Sustainability. Reviewed by Boris Gamazaychikov, Sr Manager Emissions Reduction at Salesforce. Analysis completed in partnership with WAP Sustainability. |

Starwood Hotels & Resorts
1 Hotel Hanalei Bay Luxury Resort
Starwood Hotels & Resorts
1 Hotel Hanalei Bay Luxury Resort
Princeville, HI
Brightworks provided LEED certification management and energy services to support Starwood Hotels with the major renovation and rebranding of Kauai’s Princeville Hotel into a flagship 1 Hotel resort focused on sustainable hospitality and wellness. Brightworks collaborated with the design and construction team to incorporate innovative strategies that will save energy and water, improve operations, and protect local ecosystems. Brightworks also delivered comprehensive energy modeling services, which allowed the project team to identify energy conservation measures and evaluate options.
Practices Engaged:
Sustainable Built Environments
Industry Sectors:
Hotel
Building Types:
Hotels & Resorts

Gerding Edlen
5 MLK Apartments
Gerding Edlen
5 MLK Apartments
Portland, OR
This biophilically-designed tower achieved LEED Gold and Fitwel 1 Star certification while also featuring a resiliency program. The building offers 100,000 square feet of offices on lower floors and 220 residential units with landscaped terraces above.
Practices Engaged:
Sustainable Built Environments, Healthier Built Environments
Industry Sectors:
Residential
Building Types:
Luxury Residential
City of Portland
Case Study
City of Portland
Case Study
Practices Engaged:
Healthier Built Environments
Industry Sectors:
Corporate, Government, State & Local
Building Types:
Historic Buildings
Read more
ABB
North American GreenCRREM Assessments
ABB
North American GreenCRREM Assessments
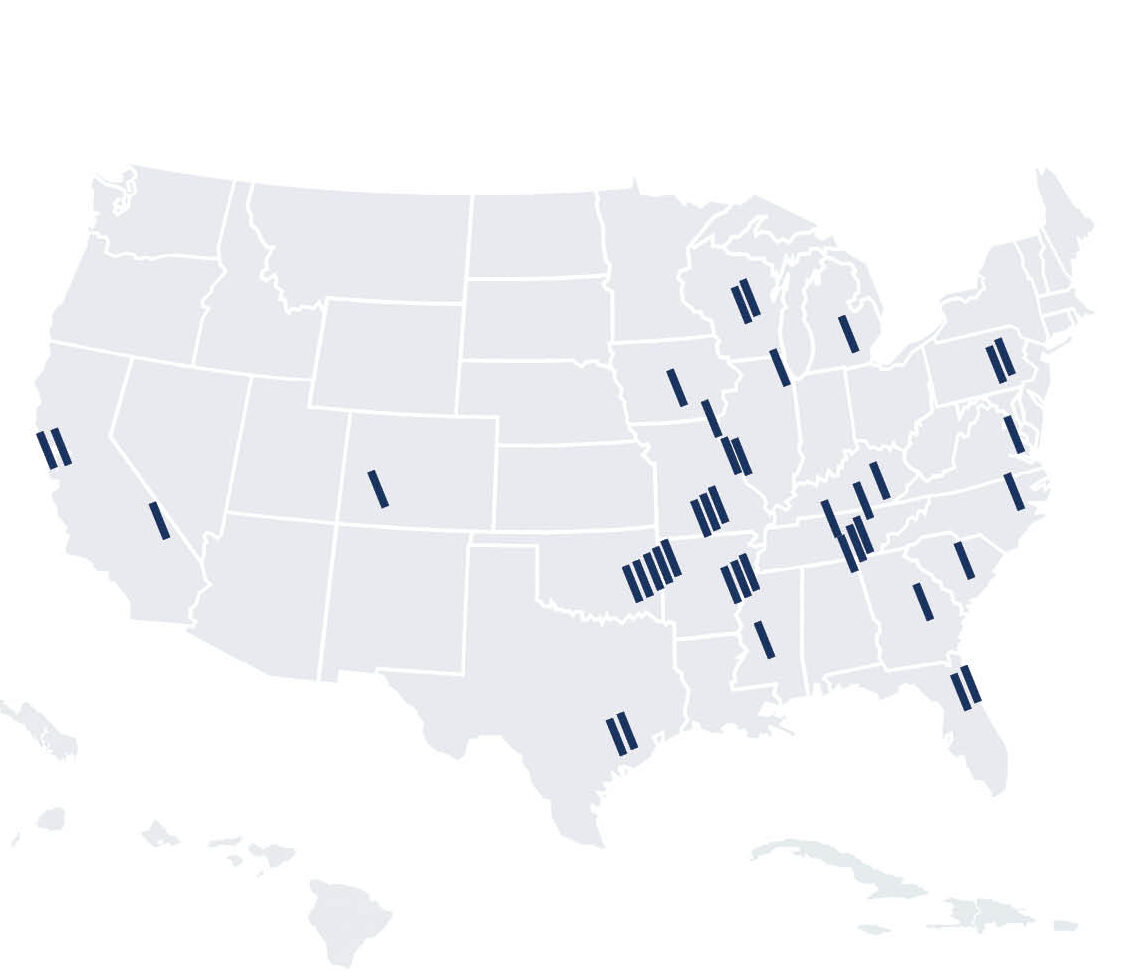
Arkansas, California, Florida, Georgia, Michican, Missouri, Mississippi, North Carolina, New Jersey, New Mexico, Oklahoma, Pennsylvania, South Carolina, Tennessee, Texas, Virginia, Wisconsin, West Virginia
ABB is a global leader in industrial technology. Across 17 states, Brightworks conducted sustainability assessments on more than 50 buildings in ABB's North American portfolio, including manufacturing, office, and warehousing facilities. An extensive report providing a baseline assessment for each site helped ABB prioritize energy efficiency measures, budget for carbon reduction efforts, and calculate ROI as part of its GreenCRREM program.
Practices Engaged:
Sustainable Built Environments, Carbon, Energy
Industry Sectors:
Corporate, Manufacturing

Salesforce
Case Study
Salesforce
Case Study
This letter to the industry highlights the urgent need to address embodied carbon in MEP/IT/AV systems. While operational emissions have seen progress, this embodied carbon remains a challenge. This article reveals insights to guide the industry toward a 50% reduction by 2030 to stay on track for meeting net-zero carbon targets for 2050.
Practices Engaged:
ESG + Corporate Sustainability, Sustainable Built Environments, Carbon, Materials
Read more
AI Meets Lower Carbon Concrete
AI Meets Lower Carbon Concrete
Concrete accounts for 8% of global GHG emissions, which is more than every country except the US and China. Lower carbon concrete is a critical climate solution, but designing it isn’t simple. While AI offers promise, experts warn of its limitations in capturing real-world variables. This post explores why human expertise still leads the way, and how integrative strategies are reshaping concrete’s future.
Practices Engaged:
Materials
Read more
-
U.S. GSA Diplomatic Security OfficeDiplomatic Security Office | Seattle, WA
-
U.S. Social Security Administration OfficeVan Nuys Office | CA