Part II: How The Grid Operates
Everything You Need To Know About How Electricity Works ...
... but may have been too embarrassed to ask
- Carbon
- ESG + Corporate Sustainability
- Energy
Practices Engaged

How the Grid Operates
PART II of IV: Grid Operations

Welcome to a 4-part series where our Operational Carbon Technical Lead and Licensed Engineer, Ilana Cember, dives into:“(Almost) Everything You Wanted to Know About Electricity But Are Embarrassed to Ask”Understanding the basics of electricity generation, distribution, purchasing, greenhouse gas emissions, and the utility grids is key to understanding how we change any of those to keep our global commitment and meet the Paris Climate Accord. We will go into the “why” for each of these topics as they are covered. TOPICS WE WILL COVER
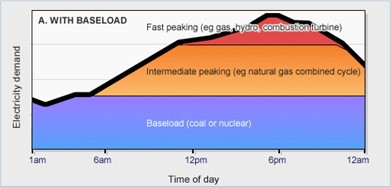
Part II: How the Grid OperatesWHY?Increases in weather-dependent or intermittent power production necessitates a different operational approach for the utility grid. We cannot make progress on the dramatic increase in utility renewables required to meet carbon emissions commitments without addressing this issue. The utility grid generally operates with a base load 24/7 with an inflexible power source like coal or nuclear. As the utility grid load increases, power plants will start production on an intermediate source that can turn on and off semi-fast, such as natural gas systems. As the grid reaches peak loads, the utility will turn on fast peaking systems like other natural gas engines. Figure 15. Grid Operations (xix)
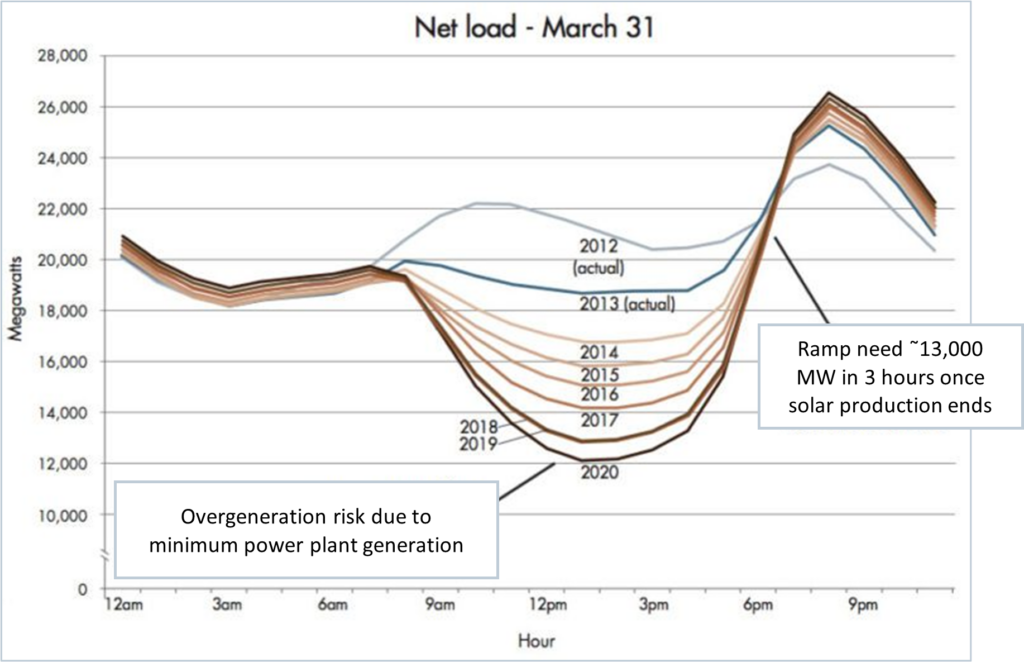
However, this grid operational approach is no longer suitable. Obviously, Solar photovoltaics only absorb energy during sunlight hours. During these sunlight hours, distributed renewables (i.e., electricity generation not on the grid, like onsite solar panels) handle an increasing percentage of the grid load. The sun setting happens to coincide with one of the utility peaks in the early evening, which is when solar production stops and facilities start pulling their energy from the grid. This incredible ramp-up puts in extraordinary burden on the grid as shown in Figure 16. In addition, during the low point of the grid (peak of solar production), the baseload systems (which has a minimum amount it must generate) may generate more than the grid needs, leading to expensive overgeneration. Figure 16. Utility Net Load Example (xx)
Unfortunately, many utilities are attempting to address this by limiting distributed solar installations. In California, for instance, distributed solar makes up nearly half of California’s solar capacity, but the Utility Commission (influenced by Pacific Gas & Electric, Southern California Edison, and San Diego Gas & Electric) is modifying the incentive structure and financial analysis to seemingly reduce distributed solar installation. (xxi) (Refer to earlier discussion on mismatched incentives for investor-owned utilities. Of course it’s impossible to say the motive but that is certainly the impact. (xxi) Alternatively, the grid must adapt and change how it operates to account for the changing grid profiles and crucial involvement of distributed energy to lower energy carbon emissions. An example is shown below – there is still an inflexible source serving the baseload, for example wind and solar, with wind dominating during the night and solar dominating during the day. (xxii) This must be supplemented with the fast-peaking flexible source, which can be accomplished using storage that can be charged and discharged as needed, as shown in Figure 17 below. Figure 17. Renewable Energy Grid (xix)
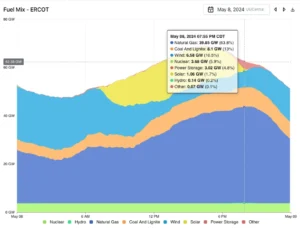
The good news is that many utilities have already begun ramping up their reliability on electric battery storage, including Texas, which has its own grid liabilities as discussed previously. In fact, as of 2023, Texas has more solar generation capacity than California and is adding battery storage close to (or more than, depending on the forecast) California’s progress. (The interconnection rate is also a lot faster, refer to Figure 5.) With no decarbonization goals, this investment is being driven by the growing need for reliable, fast-ramping, and flexible electrical generation. (xxiii) As battery prices continue to lower, we can expect this to increase across the country. In addition, utilities have already started to incentivize using electricity during the peak solar hours. In many places, electricity peak demand charges now coincide with the after sunset ramp up (e.g., 4pm-9pm) rather than the previous daytime hours (e.g., 10am-4pm). Figure 18. Fuel mix in Texas utility grid during May 8 (xxiii)
In fact, 2,600 gigawatts of electrical generation (almost all of it renewables) is waiting to be connected, as shown in Figure 19 below! (“Hybrid” refers to generating capacity with co-located batteries.) Figure 19. Utility grid interconnection queue 2010 and 2023 (viii)
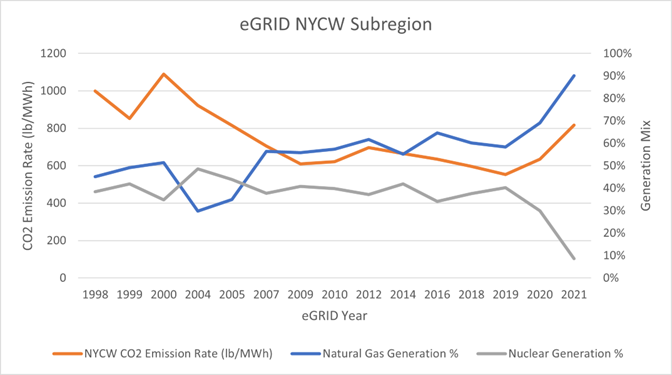
More on Grid OperationsWHY?Poor planning for grid changes can lead to dramatically worse carbon impact. Poor planning for grid changes can lead to excessive carbon emissions by causing the replacement of low-carbon energy sources with higher-emission alternatives. Without adequate foresight and preparation, the retirement of renewable or low-emission sources forces utilities to depend on fossil fuels like natural gas, significantly increasing carbon emissions. As an example, New York City electricity grid (NYCW) had generally been making progress lowering the grid’s carbon emissions since about 2000. That changed in 2020 and 2021 when the aging nuclear power plant was retired after almost 60 years in operation due to environmental and safety concerns. (xxv) Indian Point Nuclear Plant previously provided about up to 40% of NYC’s power; nuclear energy is considered to have 0 operational carbon emissions. Figure 20. NYCW eGrid Change in Carbon Emissions and Power Mix (xxvi )
Unfortunately, this was replaced almost exclusively with natural gas, causing a 60% increase in emissions intensity. Of course without more information, it’s impossible to say why there was not more advanced planning to ensure the loss of capacity was replaced with renewables instead, but New York (like California) is served primarily by investor-owned utilities and has one of the lowest interconnection rates of renewables (see Figure 5) at 8%. The phased closure was announced in 2017, providing 3 or 4 years of advanced notice. This lack of adequate preparation puts New York’s carbon goals at risk of emissions–free electricity by 2040 and 70% renewables by 2030 (xxvii). Written by Operational Carbon Technical Lead Ilana Cember, PE, CEM |


Starwood Hotels & Resorts
1 Hotel Hanalei Bay Luxury Resort
Starwood Hotels & Resorts
1 Hotel Hanalei Bay Luxury Resort
Princeville, HI
Brightworks provided LEED certification management and energy services to support Starwood Hotels with the major renovation and rebranding of Kauai’s Princeville Hotel into a flagship 1 Hotel resort focused on sustainable hospitality and wellness. Brightworks collaborated with the design and construction team to incorporate innovative strategies that will save energy and water, improve operations, and protect local ecosystems. Brightworks also delivered comprehensive energy modeling services, which allowed the project team to identify energy conservation measures and evaluate options.
Practices Engaged:
Sustainable Built Environments
Industry Sectors:
Hotel
Building Types:
Hotels & Resorts

Gerding Edlen
5 MLK Apartments
Gerding Edlen
5 MLK Apartments
Portland, OR
This biophilically-designed tower achieved LEED Gold and Fitwel 1 Star certification while also featuring a resiliency program. The building offers 100,000 square feet of offices on lower floors and 220 residential units with landscaped terraces above.
Practices Engaged:
Sustainable Built Environments, Healthier Built Environments
Industry Sectors:
Residential
Building Types:
Luxury Residential
City of Portland
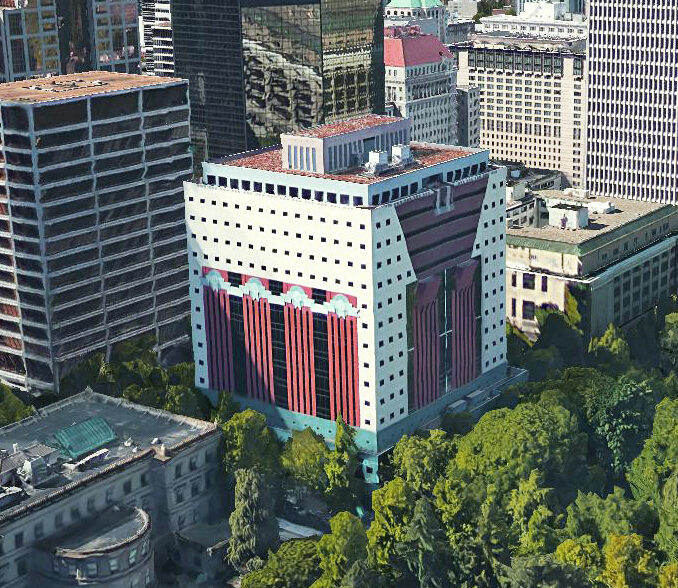
Case Study
City of Portland
Case Study
Practices Engaged:
Healthier Built Environments
Industry Sectors:
Corporate, Government, State & Local
Building Types:
Historic Buildings
Read more
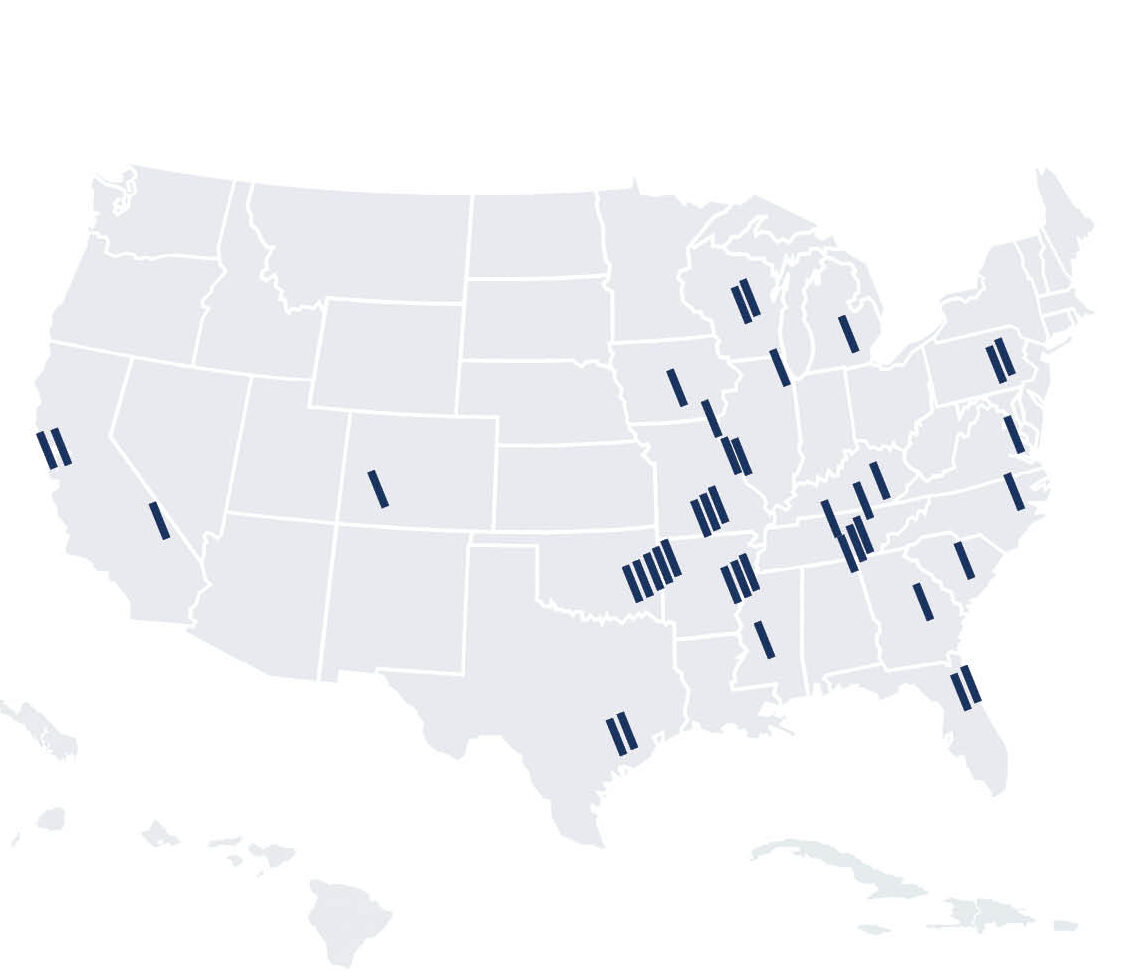
ABB
North American GreenCRREM Assessments
ABB
North American GreenCRREM Assessments
Arkansas, California, Florida, Georgia, Michican, Missouri, Mississippi, North Carolina, New Jersey, New Mexico, Oklahoma, Pennsylvania, South Carolina, Tennessee, Texas, Virginia, Wisconsin, West Virginia
ABB is a global leader in industrial technology. Across 17 states, Brightworks conducted sustainability assessments on more than 50 buildings in ABB's North American portfolio, including manufacturing, office, and warehousing facilities. An extensive report providing a baseline assessment for each site helped ABB prioritize energy efficiency measures, budget for carbon reduction efforts, and calculate ROI as part of its GreenCRREM program.
Practices Engaged:
Sustainable Built Environments, Carbon, Energy
Industry Sectors:
Corporate, Manufacturing

Salesforce
Case Study
Salesforce
Case Study
This letter to the industry highlights the urgent need to address embodied carbon in MEP/IT/AV systems. While operational emissions have seen progress, this embodied carbon remains a challenge. This article reveals insights to guide the industry toward a 50% reduction by 2030 to stay on track for meeting net-zero carbon targets for 2050.
Practices Engaged:
ESG + Corporate Sustainability, Sustainable Built Environments, Carbon, Materials
Read more

AI Meets Lower Carbon Concrete
AI Meets Lower Carbon Concrete
Concrete accounts for 8% of global GHG emissions, which is more than every country except the US and China. Lower carbon concrete is a critical climate solution, but designing it isn’t simple. While AI offers promise, experts warn of its limitations in capturing real-world variables. This post explores why human expertise still leads the way, and how integrative strategies are reshaping concrete’s future.
Practices Engaged:
Materials
Read more
-
U.S. GSA Diplomatic Security OfficeDiplomatic Security Office | Seattle, WA
-
U.S. Social Security Administration OfficeVan Nuys Office | CA